Skip to content
FacebookTwitterLinkedinYouTubeGitHubSubscribeEmailRSS
Close
Beyond Knowledge Innovation

Beyond Knowledge Innovation

Where Data Unveils Possibilities

  • Home
  • AI & ML Insights
  • Machine Learning
    • Supervised Learning
      • Introduction
      • Regression
      • Classification
    • Unsupervised Learning
      • Introduction
      • Clustering
      • Association
      • Dimensionality Reduction
    • Reinforcement Learning
    • Generative AI
  • Knowledge Base
    • Introduction To Python
    • Introduction To Data
    • Introduction to EDA
  • References
HomeImplementationSupervised LearningClassificationClassification metrics: Accuracy, Precision, Recall, and F1-score
Classification

Classification metrics: Accuracy, Precision, Recall, and F1-score

March 4, 2024March 10, 2024CEO 215 views
Suppose we have a binary classification problem in which we have to predict two classes: 1 and 0. A machine learning model tends to make some mistakes by incorrectly classifying data points, resulting in a difference between the actual and predicted class of the data point. Four possible scenarios that can happen are:

  • True Positive (TP): The values which belonged to class 1 and were predicted 1.
  • False Positive (FP): The values which belonged to class 0 and were predicted 1.
  • False Negative (FN): The values which belonged to class 1 and were predicted 0.
  • True Negative (TN): The values which belonged to class 0 and were predicted 0.

Clearly, we want True Positives and True Negatives to be predicted. However, no machine learning algorithm is completely perfect, and we end up with False Positive and False-negative due to misclassifications. This confusion in classifying the data can be easily shown by a matrix, called the Confusion Matrix:
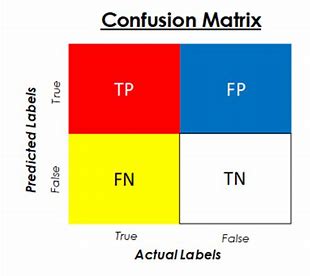
From a confusion matrix, we can obtain different measures like Accuracy, Precision, Recall, and F1 scores.

Accuracy

Accuracy represents the number of correctly classified data instances (TN+TP) over the total number of data instances (TN+TP+FN+FP) which is as follows:

\(Accuracy=\frac{TN+TP}{TN+FN+TP+FP}\)

Accuracy is a very good measure if negative and positive classes have the same number of data instances, which means that the data is balanced. In reality, we can hardly find balanced data for classification tasks.

Recall

Recall can be used as a measure, where Overlooked Cases (False Negatives) are more costly, and the focus is on finding the positive cases. The recall is calculated as follows:

\(Recall=\frac{TP}{TP+FN}\)

For example, in a loan classification model, if predict a non-delinquent customer as a delinquent customer, bank would lose an opportunity of providing loan to a potential customer. We need to reduce False Negatives, as such recall should be maximized (the greater the recall, higher the chances of minimizing the false negative).

Precision

Precision is a good evaluation metric to use when the cost of a false positive is very high and the cost of a false negative is low. Precision is calculated as follows:

\(Precision=\frac{TP}{TP+FP}\)

F1-Score

F1 score is the combination of Precision and Recall. If we want our model to be correct and not miss any correct predictions, then we want to maximize both Precision and Recall scores. F1 score is defined as follows:

\(F1-Score=2\times\frac{Precision \times Recall}{Precision + Recall}\)
accuracy, confusion matrix, f1, precision, recall

Post navigation

Previous Post
Previous post: Python warnings module
Next Post
Next post: Receiver Operating Characteristic (ROC) and Area Under Curve (AUC)

You Might Also Like

No image
Pre-pruning Decision Tree – GridSearch for Hyperparameter…
March 8, 2024 Comments Off on Pre-pruning Decision Tree – GridSearch for Hyperparameter tuning
  • Recent
  • Popular
  • Random
  • No image
    7 months ago Low-Rank Factorization
  • No image
    7 months ago Perturbation Test for a Regression Model
  • No image
    7 months ago Calibration Curve for Classification Models
  • No image
    March 15, 20240Single linkage hierarchical clustering
  • No image
    April 17, 20240XGBoost (eXtreme Gradient Boosting)
  • No image
    April 17, 20240Gradient Boosting
  • No image
    April 7, 2024BaggingClassifier from Scikit-Learn
  • No image
    March 10, 2024NumPy function argsort
  • No image
    March 15, 2024Cophenetic coefficient
  • Implementation (55)
    • EDA (4)
    • Neural Networks (10)
    • Supervised Learning (26)
      • Classification (17)
      • Linear Regression (8)
    • Unsupervised Learning (11)
      • Clustering (8)
      • Dimensionality Reduction (3)
  • Knowledge Base (44)
    • Python (27)
    • Statistics (6)
May 2025
M T W T F S S
 1234
567891011
12131415161718
19202122232425
262728293031  
« Oct    

We are on

FacebookTwitterLinkedinYouTubeGitHubSubscribeEmailRSS

Subscribe

© 2025 Beyond Knowledge Innovation
FacebookTwitterLinkedinYouTubeGitHubSubscribeEmailRSS