The logistic regression model applies the logistic function (also known as the sigmoid function) to a linear combination of input features. The logistic function transforms any real-valued number into a value between 0 and 1. The equation for logistic regression can be expressed as follows:
Here:
- ( \(P(Y=1)\) ) is the probability that the dependent variable ( Y ) belongs to class 1.
- ( \(e\) ) is the base of the natural logarithm.
- \(( b_0, b_1, b_2, …, b_n )\) are the coefficients.
- \(( x_1, x_2, …, x_n )\) are the input features.
Logistic Regression uses a process called Maximum Likelihood Estimation (MLE) to find the optimal values for the coefficients that maximize the likelihood of observing the given data.
Once the model is trained, predictions can be made by comparing the predicted probabilities to a chosen threshold (often 0.5). If the predicted probability is above the threshold, the instance is classified as belonging to class 1; otherwise, it is classified as belonging to class 0.
Logistic Regression is widely used for binary classification problems, and it is a foundational algorithm in the field of machine learning. It is simple, interpretable, and can be a good choice for certain types of datasets. However, it assumes a linear relationship between the input features and the log-odds of the output, and it may not perform well on highly non-linear datasets.
What is ‘log odds’ in Logistic Regression?
To understand log odds, we should first understand odds ratios. In statistics, ‘odds’ is typically defined as the likelihood that an event will occur divided by the probability that it will not occur. In other terms, it is the proportion of successes (or wins) to losses (or failures).
Where P = Probability of the event occurring
For two events, A and B, the odds ratio is defined as the ratio of the odds of A in the presence of B and the odds of A in the absence of B, or equivalently (due to symmetry), the ratio of the odds of B in the presence of A and the odds of B in the absence of A.
The log odds are obtained by taking the logarithm of the odds ratio.
Log odds (also known as the logit function) are extremely important as they are the coefficients in logistic regression. This means that plugging the values into the logistic regression equation will provide the (natural) log-odds value for the given data.
What is the Sigmoid function?
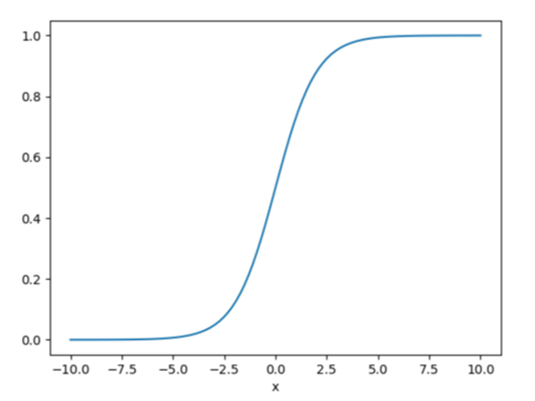
The sigmoid is a mathematical function that takes any real number and maps it to a probability between 1 and 0.
The sigmoid function forms an S-shaped graph, which means as x approaches infinity, the probability becomes 1, and as x approaches negative infinity, the probability becomes 0.
The below figure shows what a sigmoid function looks like: