Skip to content
FacebookTwitterLinkedinYouTubeGitHubSubscribeEmailRSS
Close
Beyond Knowledge Innovation

Beyond Knowledge Innovation

Where Data Unveils Possibilities

  • Home
  • AI & ML Insights
  • Machine Learning
    • Supervised Learning
      • Introduction
      • Regression
      • Classification
    • Unsupervised Learning
      • Introduction
      • Clustering
      • Association
      • Dimensionality Reduction
    • Reinforcement Learning
    • Generative AI
  • Knowledge Base
    • Introduction To Python
    • Introduction To Data
    • Introduction to EDA
  • References
HomeKnowledge BaseWhat is Binomial Distribution?
Knowledge Base Statistics

What is Binomial Distribution?

February 21, 2024February 22, 2024CEO 202 views
The binomial distribution is a discrete probability distribution that describes the number of successes in a fixed number of independent Bernoulli trials, each with the same probability of success. In other words, it models the number of successes (e.g., heads in a series of coin flips) in a fixed number of independent experiments, where each experiment has only two possible outcomes (success or failure).

The key characteristics of a binomial distribution are:

  • Two Outcomes: Each trial has only two possible outcomes, typically labeled as “success” and “failure.”
  • Fixed Number of Trials: The number of trials (experiments) is fixed in advance.
  • Independent Trials: Each trial is independent of the others, meaning the outcome of one trial does not influence the outcomes of the others.
  • Constant Probability: The probability of success is the same for each trial.

The probability mass function (PMF) of the binomial distribution is given by the formula:
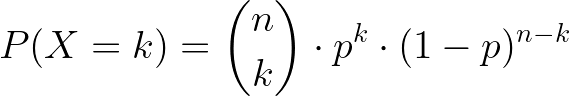
where:

The mean (μ) and variance of a binomial distribution are given by:

\( \mu = n \cdot p
\)
\( \sigma^2 = n \cdot p \cdot (1 – p)
\)

Binomial distributions are commonly used in statistics and probability theory to model scenarios involving repeated, independent trials with binary outcomes. Examples include coin flips, success/failure experiments, and certain types of counting processes.

In real life, the concept is used for:

  • Finding the quantity of raw and used materials while making a product.
  • Taking a survey of positive and negative reviews from the public for any specific product or place.
  • By using the YES/ NO survey, we can check whether the number of persons views the particular channel.
  • To find the number of male and female employees in an organisation.
  • The number of votes collected by a candidate in an election is counted based on 0 or 1 probability.

Binomial Distribution Vs Normal Distribution

The main difference between the binomial distribution and the normal distribution is that binomial distribution is discrete, whereas the normal distribution is continuous. It means that the binomial distribution has a finite number of events, whereas the normal distribution has an infinite number of events. In case, if the sample size for the binomial distribution is very large, then the distribution curve for the binomial distribution is similar to the normal distribution curve.

binomial distribution in Python

If you want to draw a binomial distribution in Python, you can use the scipy.stats module along with matplotlib for visualization. Here’s an example:

import numpy as np
import matplotlib.pyplot as plt
from scipy.stats import binom

# Set the parameters for the binomial distribution
n = 15  # Number of trials
p = 0.5  # Probability of success

# Generate x values (number of successes)
x = np.arange(0, n+1)

# Calculate the probability mass function (PMF) for each x
pmf = binom.pmf(x, n, p)

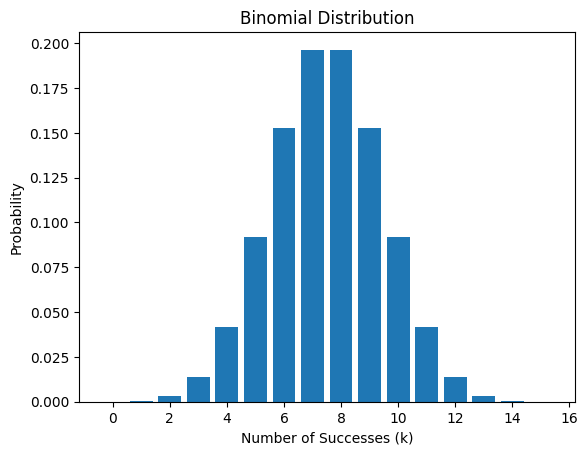
# Plot the binomial distribution
plt.bar(x, pmf)
plt.xlabel('Number of Successes (k)')
plt.ylabel('Probability')
plt.title('Binomial Distribution')
plt.show()
binomial, distribution, statistics

Post navigation

Previous Post
Previous post: How-to: save a Google Colab notebook as HTML
Next Post
Next post: What is Uniform Distribution?

You Might Also Like

No image
What is Uniform Distribution?
February 22, 2024 Comments Off on What is Uniform Distribution?
No image
What is Gaussian Distribution?
February 9, 2024 Comments Off on What is Gaussian Distribution?
  • Recent
  • Popular
  • Random
  • No image
    7 months ago Low-Rank Factorization
  • No image
    7 months ago Perturbation Test for a Regression Model
  • No image
    7 months ago Calibration Curve for Classification Models
  • No image
    March 15, 20240Single linkage hierarchical clustering
  • No image
    April 17, 20240XGBoost (eXtreme Gradient Boosting)
  • No image
    April 17, 20240Gradient Boosting
  • No image
    August 12, 2024Correlation Coefficient
  • No image
    October 21, 2024Calibration Curve for Classification Models
  • No image
    April 23, 2024Oversampling Technique – SMOTE
  • Implementation (55)
    • EDA (4)
    • Neural Networks (10)
    • Supervised Learning (26)
      • Classification (17)
      • Linear Regression (8)
    • Unsupervised Learning (11)
      • Clustering (8)
      • Dimensionality Reduction (3)
  • Knowledge Base (44)
    • Python (27)
    • Statistics (6)
May 2025
M T W T F S S
 1234
567891011
12131415161718
19202122232425
262728293031  
« Oct    

We are on

FacebookTwitterLinkedinYouTubeGitHubSubscribeEmailRSS

Subscribe

© 2025 Beyond Knowledge Innovation
FacebookTwitterLinkedinYouTubeGitHubSubscribeEmailRSS