
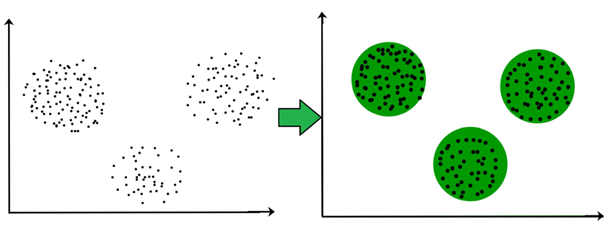
Clustering is common and useful for exploring new data where patterns between data points, such as high-level categories, aren’t yet known. The goal of clustering algorithm is to find the optimal way to split the dataset into groups.
To visualize data, we use a mathematical technique called Principal Component Analysis (PCA), to analyze the relationship between the features and summarize each observation as coordinates for two principal components – in other word, we’ll translate a multi-dimensional feature values into two-dimensional coordinates.
Connectivity-based and centroid-based clustering are two distinct approaches to clustering data, each with its own characteristics and methods. Let’s explore:
Centroid-based Clustering
K-means is a popular unsupervised machine learning algorithm used in centroid-based clustering, which is the task of grouping similar data points together. The goal of k-means is to partition a dataset into a predetermined number of clusters, where each data point belongs to the cluster with the nearest mean (centroid).
In K-Means, each cluster is associated with a centroid.
Here’s a step-by-step explanation of the k-means algorithm:
- Initialization: Choose the number of clusters (k) you want to identify in your dataset. Randomly initialize k centroids, each representing the center of one cluster.
- Assignment: Assign each data point to the cluster whose centroid is the closest, typically using Euclidean distance. The distance between a data point and a centroid is calculated in the feature space.
- Update Centroids: Recalculate the centroids of each cluster by taking the mean of all data points assigned to that cluster. This new centroid becomes the center of the cluster.
- Repeat: Repeat steps 2 and 3 until convergence. Convergence occurs when the assignment of data points to clusters and the recalculation of centroids no longer significantly change.
To find the cluster centroid in k-means clustering, you need to calculate the mean of each feature (dimension) separately for all the points in the cluster.
Let’s calculate the centroid for the following given points: (1,2), (3,-2), and (5,3)
Mean of x-coordinate: \(\bar{X}=\frac{1+3+5}{3}=\frac{9}{3}=3\)
Mean of y-coordinate: \(\bar{y}=\frac{2+(−2)+3}{3}=\frac{3}{3}=1\)
So, the centroid of the cluster formed by the points (1,2), (3,-2), and (5,3) is (3,1)
Connectivity-based
Hierarchical clustering is a connectivity-based clustering algorithm that organizes data points into a tree-like structure called a dendrogram. It builds a hierarchy of clusters by recursively merging or splitting them based on a measure of similarity or dissimilarity between the data points. There are two main types of hierarchical clustering: agglomerative and divisive.
Agglomerative Hierarchical Clustering:
- Bottom-Up Approach: It starts with each data point as a separate cluster and iteratively merges the closest pairs of clusters until only one cluster remains.
- Linkage Methods: The choice of a linkage method determines how the distance between two clusters is calculated. Common linkage methods include:
- Single Linkage (or Minimum Linkage): Measures the distance between the closest points of two clusters.
- Complete Linkage (or Maximum Linkage): Measures the distance between the farthest points of two clusters.
- Average Linkage: Measures the average distance between all pairs of points from two clusters.
- Ward’s Method: Minimizes the variance within each cluster when merging.
Divisive Hierarchical Clustering:
- Top-Down Approach: It starts with all data points in a single cluster and recursively splits them into smaller clusters until each data point is in its own cluster.
- Divisive hierarchical clustering is less common and often computationally more intensive than agglomerative clustering.
Steps of Agglomerative Hierarchical Clustering:
- Initialization: Treat each data point as a singleton cluster.
- Compute Pairwise Distances: Calculate the distance (or similarity) between all pairs of clusters.
- Merge Closest Clusters: Merge the two closest clusters based on the chosen linkage method.
- Update Distance Matrix: Recalculate the distances between the new cluster and the remaining clusters.
- Repeat: Repeat steps 3-4 until only one cluster remains.
Dendrogram:
- A dendrogram is a tree diagram that represents the hierarchy of clusters. The vertical lines in the dendrogram represent clusters, and the height at which two branches merge or split indicates the distance (or dissimilarity) at which the clusters were combined or divided.
Hierarchical clustering has the advantage of providing a visual representation of the clustering process through the dendrogram. The choice of linkage method and distance metric can significantly impact the results, so it’s essential to carefully select these parameters based on the characteristics of the data and the goals of the analysis. Additionally, hierarchical clustering is not well-suited for very large datasets due to its computational complexity.
Go back to Unsupervised Learning