Skip to content
FacebookTwitterLinkedinYouTubeGitHubSubscribeEmailRSS
Close
Beyond Knowledge Innovation

Beyond Knowledge Innovation

Where Data Unveils Possibilities

  • Home
  • AI & ML Insights
  • Machine Learning
    • Supervised Learning
      • Introduction
      • Regression
      • Classification
    • Unsupervised Learning
      • Introduction
      • Clustering
      • Association
      • Dimensionality Reduction
    • Reinforcement Learning
    • Generative AI
  • Knowledge Base
    • Introduction To Python
    • Introduction To Data
    • Introduction to EDA
  • References
HomeImplementationUnsupervised LearningDimensionality Reductiont-distributed Stochastic Neighbor Embedding (t-SNE)
Dimensionality Reduction

t-distributed Stochastic Neighbor Embedding (t-SNE)

March 17, 2024April 1, 2024CEO 174 views

t-SNE, which stands for t-distributed Stochastic Neighbor Embedding, is a popular dimensionality reduction technique (of type Feature Extraction) used in machine learning and data visualization. It is particularly useful for visualizing high-dimensional data in a lower-dimensional space, typically two or three dimensions, while preserving the local structure of the data as much as possible.

The main idea behind t-SNE is to map high-dimensional data points to a lower-dimensional space in such a way that similar points in the high-dimensional space are represented as nearby points in the low-dimensional space, while dissimilar points are represented as distant points. This is achieved by modeling the similarity between data points in both the high-dimensional and low-dimensional spaces using probability distributions and minimizing the mismatch between them.

t-SNE is commonly used in exploratory data analysis, clustering, and visualization tasks, especially when dealing with complex and nonlinear relationships in the data. However, it’s important to note that t-SNE is computationally expensive and may not always preserve global structures accurately, especially in cases of very high-dimensional data. Additionally, t-SNE is sensitive to its hyperparameters, and different parameter settings can lead to different visualizations.

Example

import pandas as pd
import numpy as np
import matplotlib.pyplot as plt
%matplotlib inline
import seaborn as sns

sns.set_theme()

pd.set_option('display.max_rows', 200)
pd.set_option('display.max_columns', None)
pd.set_option('display.float_format', '{:,.2f}'.format)

from scipy.stats import zscore
from sklearn.manifold import TSNE

# X is the numeric columns
X_scaled = X.apply(zscore)

tsne = TSNE(n_components=2, random_state=1)
X_reduced = tsne.fit_transform(X_scaled)

df = pd.DataFrame(X_reduced, columns=['component1', 'component2'])

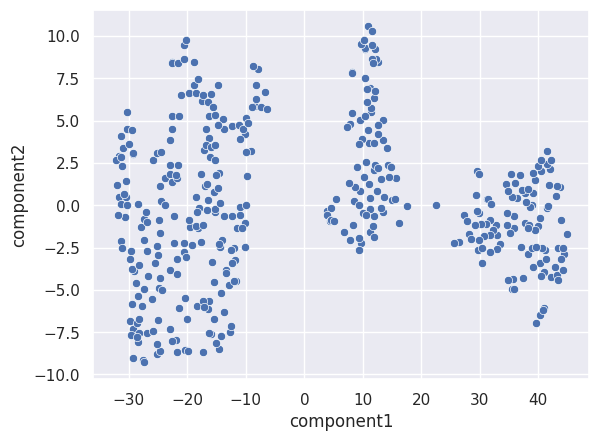
sns.scatterplot(x=df['component1'], y=df['component2'])
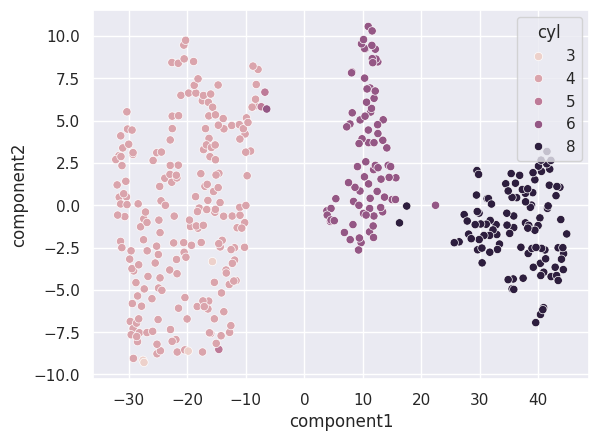
sns.scatterplot(x=df['component1'], y=df['component2'], hue=data['cyl'])
dimensionality, t-sne, unsupervised

Post navigation

Previous Post
Previous post: Principal Component Analysis (PCA)
Next Post
Next post: Parameter stratify from method train_test_split in scikit Learn

You Might Also Like

No image
Principal Component Analysis (PCA)
March 15, 2024 Comments Off on Principal Component Analysis (PCA)
No image
Unsupervised Learning Dimensionality Reduction – Feature Elimination…
March 15, 2024 Comments Off on Unsupervised Learning Dimensionality Reduction – Feature Elimination vs Extraction
No image
Complete linkage hierarchical clustering
March 15, 2024 Comments Off on Complete linkage hierarchical clustering
No image
Single linkage hierarchical clustering
March 15, 2024 Comments Off on Single linkage hierarchical clustering
No image
Finding the optimal number of clusters (k)…
March 11, 2024 Comments Off on Finding the optimal number of clusters (k) using Elbow Method
  • Recent
  • Popular
  • Random
  • No image
    7 months ago Low-Rank Factorization
  • No image
    7 months ago Perturbation Test for a Regression Model
  • No image
    7 months ago Calibration Curve for Classification Models
  • No image
    March 15, 20240Single linkage hierarchical clustering
  • No image
    April 17, 20240XGBoost (eXtreme Gradient Boosting)
  • No image
    April 17, 20240Gradient Boosting
  • No image
    May 9, 2024What is Deep Learning
  • No image
    January 16, 2024Improve model with hyperparameters
  • No image
    March 7, 2024Import your functions library to a Google…
  • Implementation (55)
    • EDA (4)
    • Neural Networks (10)
    • Supervised Learning (26)
      • Classification (17)
      • Linear Regression (8)
    • Unsupervised Learning (11)
      • Clustering (8)
      • Dimensionality Reduction (3)
  • Knowledge Base (44)
    • Python (27)
    • Statistics (6)
June 2025
M T W T F S S
 1
2345678
9101112131415
16171819202122
23242526272829
30  
« Oct    

We are on

FacebookTwitterLinkedinYouTubeGitHubSubscribeEmailRSS

Subscribe

© 2025 Beyond Knowledge Innovation
FacebookTwitterLinkedinYouTubeGitHubSubscribeEmailRSS