In pandas, you can give a specific sorting order to categorical values by creating a categorical variable with an ordered category. Here’s an example:
import pandas as pd

# Sample DataFrame
data = {'day': ['Monday', 'Wednesday', 'Friday', 'Tuesday', 'Thursday']}
df = pd.DataFrame(data)

# Define the custom order for sorting
custom_order = ['Monday', 'Tuesday', 'Wednesday', 'Thursday', 'Friday']

# Convert 'day' column to a categorical variable with custom order
df['day'] = pd.Categorical(df['day'], categories=custom_order, ordered=True)

# Sort the DataFrame based on the custom order
df = df.sort_values('day')

# Display the sorted DataFrame
print(df)
         day
0     Monday
3    Tuesday
1  Wednesday
4   Thursday
2     Friday
In this example:
- We create a DataFrame with a ‘day’ column containing days of the week in a random order.
- We define a custom order for sorting (‘custom_order’).
- We convert the ‘day’ column to a categorical variable using
pd.Categoricalwith the specified custom order and settingordered=True. - We use
df.sort_values('day')to sort the DataFrame based on the custom order. - The resulting DataFrame will have rows sorted according to the custom order of the ‘day’ column.
This can be useful when you want to ensure that certain operations, such as sorting or plotting, take into account the natural order of the days of the week.
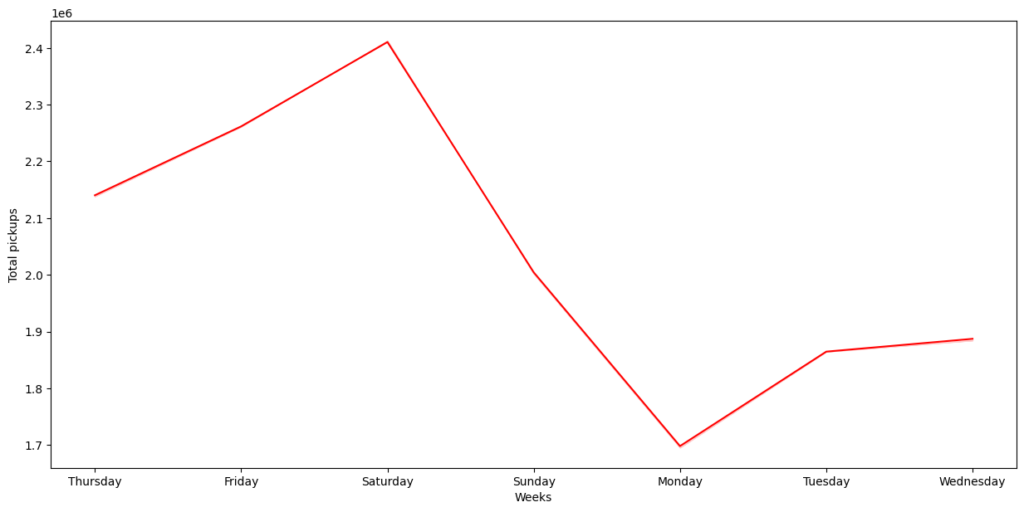
Drawing a graph before adding sort order to the week_day categorical value:
# Assume pickup_dt is object . We can change the data type of pickup_dt to date-time format.
df['pickup_dt'] = pd.to_datetime(df['pickup_dt'], format="%d-%m-%Y %H:%M")

# Now we can extract date parts from pickup date
df['start_year'] = df.pickup_dt.dt.year # extracting the year from the date
df['start_month'] = df.pickup_dt.dt.month_name() # extracting the month name from the date
df['start_hour'] = df.pickup_dt.dt.hour # extracting the hour from the time
df['start_day'] = df.pickup_dt.dt.day # extracting the day from the date
df['week_day'] = df.pickup_dt.dt.day_name() # extracting the day of the week from the date

# let's draw a lineplot for week_day and pickups
plt.figure(figsize=(15,7))
sns.lineplot(data=df, x="week_day", y="pickups", ci=False, color="red", estimator='sum')
plt.ylabel('Total pickups')
plt.xlabel('Weeks')
plt.show()
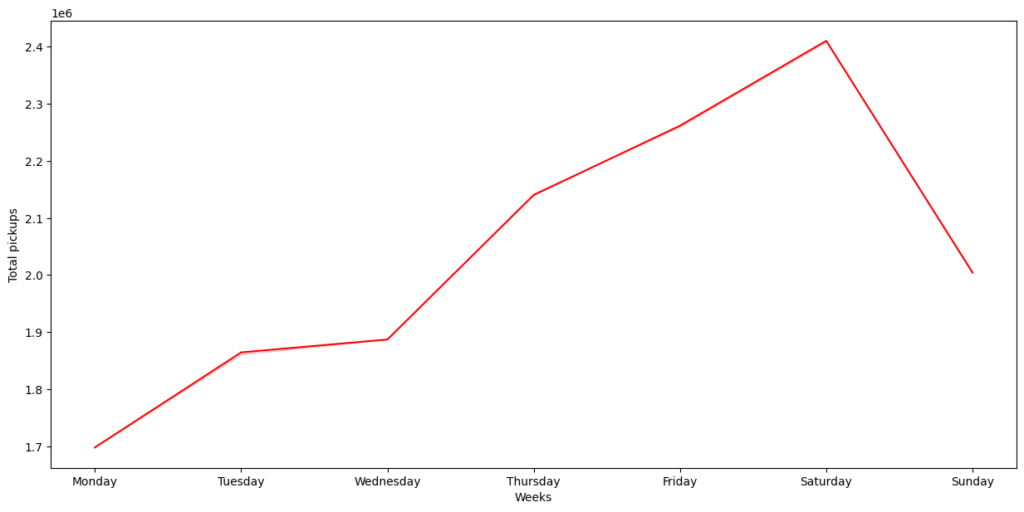
After adding sort order to the week_day categorical value:
cats = ['Monday', 'Tuesday', 'Wednesday','Thursday', 'Friday', 'Saturday', 'Sunday']
df.week_day = pd.Categorical(df.week_day, ordered=True, categories=cats)

plt.figure(figsize=(15,7))
sns.lineplot(data=df, x="week_day", y="pickups", ci=False, color="red", estimator='sum')
plt.ylabel('Total pickups')
plt.xlabel('Weeks')
plt.show()