Skip to content
FacebookTwitterLinkedinYouTubeGitHubSubscribeEmailRSS
Close
Beyond Knowledge Innovation

Beyond Knowledge Innovation

Where Data Unveils Possibilities

  • Home
  • AI & ML Insights
  • Machine Learning
    • Supervised Learning
      • Introduction
      • Regression
      • Classification
    • Unsupervised Learning
      • Introduction
      • Clustering
      • Association
      • Dimensionality Reduction
    • Reinforcement Learning
    • Generative AI
  • Knowledge Base
    • Introduction To Python
    • Introduction To Data
    • Introduction to EDA
  • References
HomeKnowledge BaseFinding missing data in a dataset
Knowledge Base

Finding missing data in a dataset

January 16, 2024January 16, 2024CEO 226 views

Do we have a complete dataset in a real-world scenario?

No. We know from history that there is missing information in our data! How can we tell if the data we have available is complete?

We could print the entire dataset, but this could involve human error, and it would become impractical with this many samples. A better option would use pandas to report the columns that have “empty” cells:

# Calculate the number of empty cells in each column
missing_data = dataset.isnull().sum().to_frame()

# Rename column holding the sums
missing_data = missing_data.rename(columns={0:'Empty Cells'})

# Print the results
print(missing_data)
             Empty Cells
PassengerId            0
Survived               0
Pclass                 0
Name                   0
Sex                    0
Age                  177
SibSp                  0
Parch                  0
Ticket                 0
Fare                   0
Cabin                687
Embarked               2

It looks like we don’t know the age of 177 passengers, and we don’t know if two of them even embarked. Cabin information for a whopping 687 persons is also missing.

Missing Data Visualizations

Sometimes it can help if we can see if the missing data form some kind of pattern.

We can plot the absence of data in a few ways. One of the most helpful is to literally plot gaps in the dataset:

# import missingno package
import missingno as msno

# Plot a matrix chart, set chart and font size
msno.matrix(dataset, figsize=(10,5), fontsize=11)

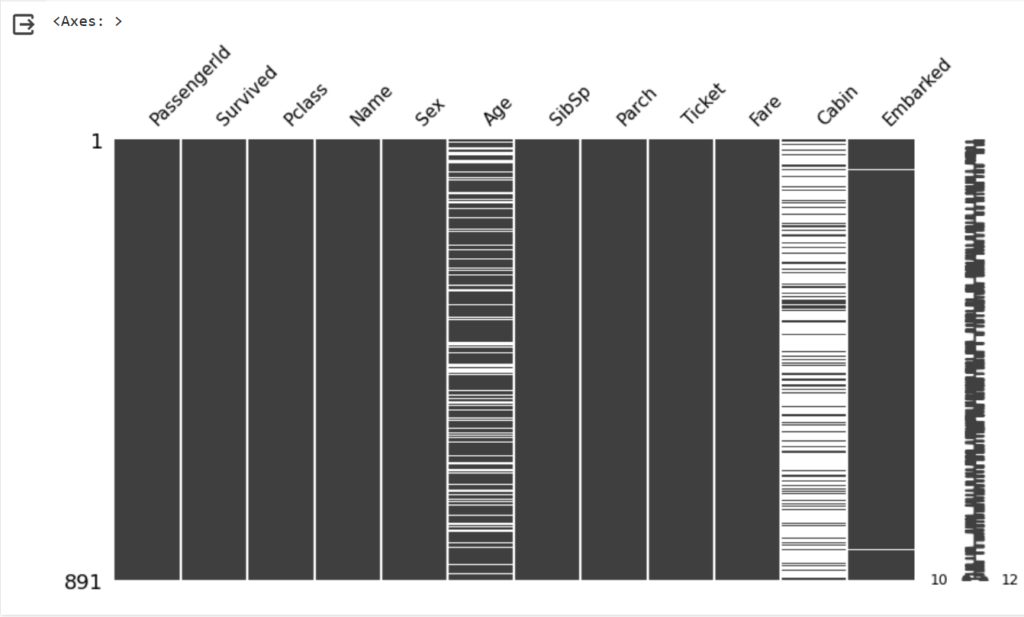
The white bars in column Age and Cabin of the graph show missing data.

Missing as Zero

Some datasets may have missing values that appear as zero, but in some other datasets, zero could be a valid data. It can be important to time the review of your raw data before you run the analyses.

This example below, our analyses have considered the values of 0 to not be ‘missing’ but rather to be actual ages:

import numpy as np

# Print out the average age of passengers for whom we have age data
mean_age = np.mean(dataset.Age)
print("The average age on the ship was", mean_age, "years old")

# Now, make another model where missing ages contained a '0'
dataset['Age_2'] = dataset['Age'].fillna(0)
mean_age = np.mean(dataset.Age_2)
print("The average age on the ship was", mean_age, "years old")
The average age on the ship was 29.69911764705882 years old
The average age on the ship was 23.79929292929293 years old
previous
next step
data, missing data, preprocessing

Post navigation

Previous Post
Previous post: Improve model with hyperparameters
Next Post
Next post: Handling missing data in a dataset

You Might Also Like

No image
Handling missing values with SimpleImputer
April 24, 2024 Comments Off on Handling missing values with SimpleImputer
No image
Standardizing features by StandardScaler
March 11, 2024 Comments Off on Standardizing features by StandardScaler
No image
One-Hot Encoding
February 29, 2024 Comments Off on One-Hot Encoding
No image
How-to: give a specific sorting order to…
February 7, 2024 Comments Off on How-to: give a specific sorting order to categorical values
No image
How-to: cap/clip outliers in a column
February 6, 2024 Comments Off on How-to: cap/clip outliers in a column
  • Recent
  • Popular
  • Random
  • No image
    7 months ago Low-Rank Factorization
  • No image
    7 months ago Perturbation Test for a Regression Model
  • No image
    7 months ago Calibration Curve for Classification Models
  • No image
    March 15, 20240Single linkage hierarchical clustering
  • No image
    April 17, 20240XGBoost (eXtreme Gradient Boosting)
  • No image
    April 17, 20240Gradient Boosting
  • No image
    January 18, 2024What is NumPy?
  • No image
    June 20, 2024Delete a folder in Google Colab
  • No image
    March 15, 2024Single linkage hierarchical clustering
  • Implementation (55)
    • EDA (4)
    • Neural Networks (10)
    • Supervised Learning (26)
      • Classification (17)
      • Linear Regression (8)
    • Unsupervised Learning (11)
      • Clustering (8)
      • Dimensionality Reduction (3)
  • Knowledge Base (44)
    • Python (27)
    • Statistics (6)
May 2025
M T W T F S S
 1234
567891011
12131415161718
19202122232425
262728293031  
« Oct    

We are on

FacebookTwitterLinkedinYouTubeGitHubSubscribeEmailRSS

Subscribe

© 2025 Beyond Knowledge Innovation
FacebookTwitterLinkedinYouTubeGitHubSubscribeEmailRSS