The role of a data scientist primarily involves exploring and analyzing data. Although the end result of data analysis might be a report or a machine learning model, data scientists begin their work with data.
Usually a data-analysis project is designed to establish insights around a particular scenario or to test a hypothesis.
Exploratory Data Analysis (EDA) is an approach to analyzing and visualizing data sets with the goal of summarizing their main characteristics, often employing statistical and graphical methods. The primary objective of EDA is to understand the underlying patterns, structures, and relationships in the data, as well as to identify any anomalies or outliers.Key aspects of Exploratory Data Analysis include:
- Data Summarization: Descriptive statistics such as mean, median, mode, range, and standard deviation are calculated to summarize the main characteristics of the data.
- Univariate Analysis: Analyzing individual variables in isolation to understand their distribution, central tendency, and variability.
- Bivariate Analysis: Investigating relationships between pairs of variables to understand dependencies and correlations.
- Multivariate Analysis: Exploring interactions among multiple variables simultaneously, often using advanced statistical techniques.
- Data Visualization: Creating visual representations of the data through charts, graphs, histograms, scatter plots, and other visualization tools to reveal patterns and trends.
- Handling Missing Data: Identifying and addressing missing values in the dataset to ensure data quality.
- Outlier Detection: Identifying and handling outliers or anomalies that may affect the analysis.
- Pattern Recognition: Identifying any recognizable patterns or structures in the data that may inform subsequent analysis or modeling.
Exploratory Data Analysis is typically conducted at the early stages of a data science or data analysis project. It helps analysts and data scientists gain insights into the dataset, formulate hypotheses, and make informed decisions about the next steps in the analysis process. EDA is an iterative and interactive process, and the insights gained from EDA can guide further statistical modeling, hypothesis testing, and feature engineering.
The tools used for EDA may include statistical software (like R or Python with libraries such as pandas, matplotlib, and seaborn), data visualization tools, and interactive dashboards. EDA is a crucial step in the overall data analysis workflow, providing a foundation for subsequent analyses and decision-making.
Descriptive statistics and data distribution
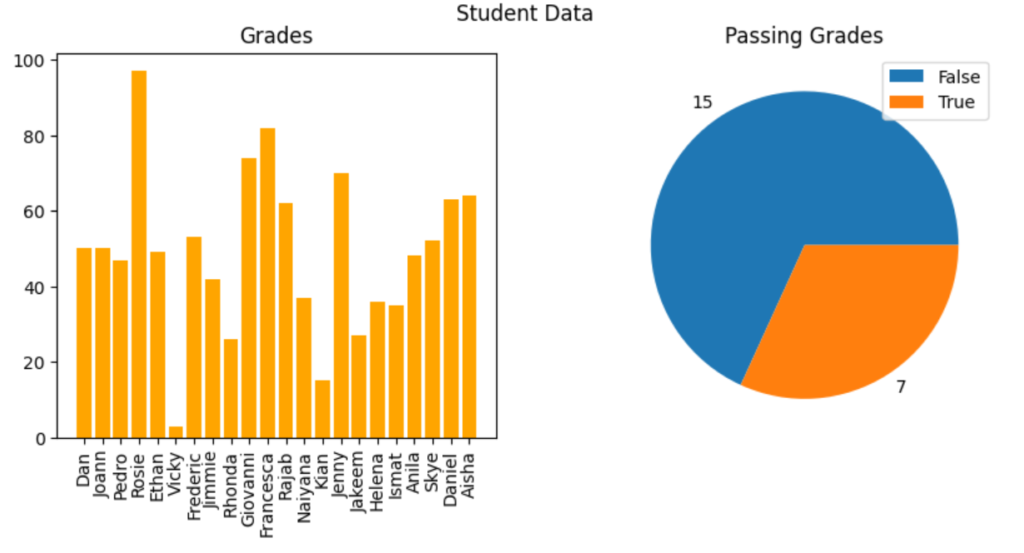
When examining a variable (for example, a sample of student grades), data scientists are particularly interested in distribution. The starting point for this exploration is often to visualize the data as a histogram and see how frequently each value for the variable occurs.
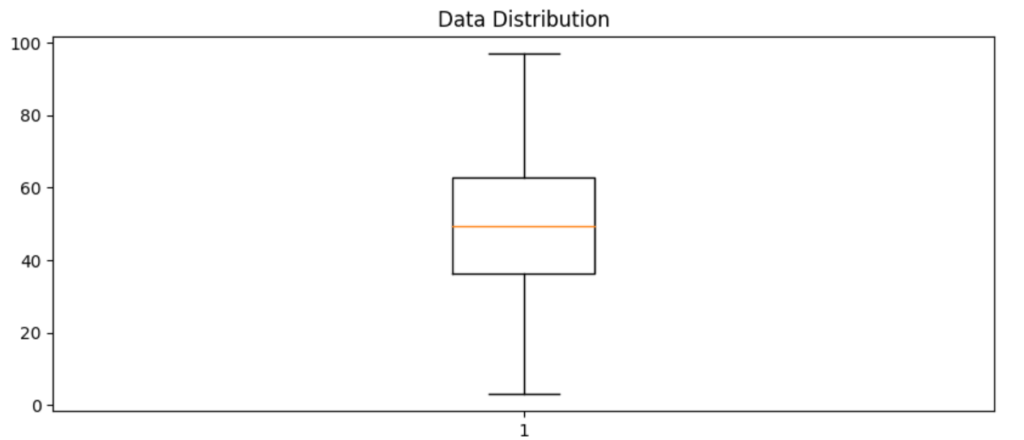
Another way to visualize the distribution of a variable is to use a box plot (sometimes called a box-and-whiskers plot). Another way to visualize the distribution of a variable is to use a box plot (sometimes called a box-and-whiskers plot), the whiskers extending from the box show the outer two quartiles.
Measures of central tendency
To understand the distribution better, we can examine so-called measures of central tendency, which is a fancy way of describing statistics that represent the “middle” of the data. The goal of this analysis is to try to find a “typical” value. Common ways to define the middle of the data include:
- mean: A simple average based on adding together all of the values in the sample set and then dividing the total by the number of samples.
- median: The value in the middle of the range of all of the sample values.
- mode: The most commonly occurring value in the sample set. In some sample sets, there might be a tie for the most common value. In those cases, the dataset is described as bimodal or even multimodal.
Measures of variance
There’s another aspect of the distributions we should examine: how much variability is there in the data?
Typical statistics that measure variability in the data include:
- Range: The difference between the maximum and minimum.
- Variance: The average of the squared difference from the mean.
- Standard Deviation: The square root of the variance.
Of these statistics, the standard deviation is generally the most useful. It provides a measure of variance in the data on the same scale as the data itself. The higher the standard deviation, the more variance there is when comparing values in the distribution to the distribution mean; in other words, the data is more spread out.
When working with a normal distribution, the standard deviation works with the particular characteristics of a normal distribution to provide even greater insight. The horizontal lines show the percentage of data within one, two, and three standard deviations of the mean (plus or minus).
In any normal distribution:
- Approximately 68.26% of values fall within one standard deviation from the mean.
- Approximately 95.45% of values fall within two standard deviations from the mean.
- Approximately 99.73% of values fall within three standard deviations from the mean.