For training our model with need a large, representative data sample that has zero errors and contains all key information. Data can be any unprocessed fact, value, text, sound, or picture that is not being interpreted and analyzed. Scientists rely on two key concepts: population and sample, to decide if available data resources help their analysis and study. A sample refers to the data available to us, as a subset of the total population. We need to think about whether the sample accurately represents the population.

Data gets interpreted and manipulated to have meaningful inference for the organization. Combination of inferred information, experiences, learning, and insights, results in awareness for the organization.
Data exploration is the first step in any machine-learning project. The goal of this exploration is to try to understand the relationships between its attributes. This may require some work to detect and fix issues in the data, such as:- Cleaning which is about dealing with missing values, errors, or outlier values.
- Feature engineering which is about deriving new feature columns by transforming or combining existing features.
- Normalization typically involves scaling down data down to a smaller range of values such as between 0 and 1 to make the training process faster.
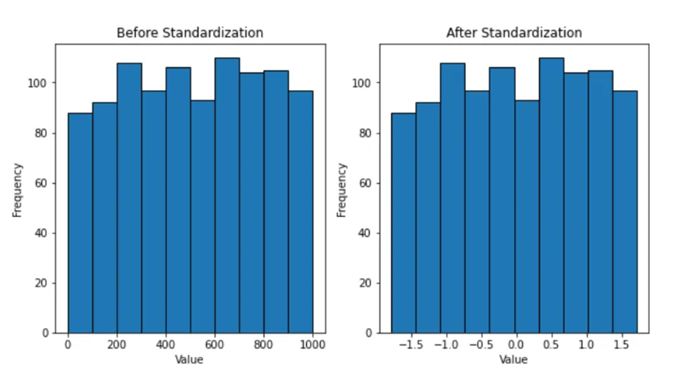
- Standardization transforms data with a mean of 0 and a standard deviation of 1.
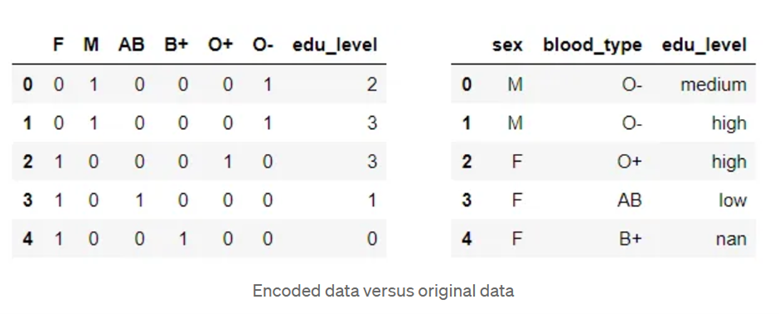
- Encoding categorical features (values that represent discrete categories) as numeric indicators.
What is data error?
The term data error refers to incorrect data. We can group data error in two categories:
- Measurement errors: The term measurement errors refer to data with low-quality measurement at the data-collection phase. These errors are often difficult or impossible to eliminate. For example, data that a sensor is collecting may be misleading.
- Data entry errors: The term data entry error refers to data collected with accuracy, but then incorrectly or inaccurately stored. For example, we might measure someone as 5.8’ tall but misplace the decimal and write 58’ tall.
What is complete data?
Complete dataset is a dataset that has no missing value. For example, if a key column in a dataset is null for some rows, the data is incomplete. For incomplete date, we can:
- Choose a model that can work with incomplete data, or
- Remove samples (rows) that have incomplete data and work with the remaining data, or
- Artificially add values as reasonable substitutes for the missing data
When removing incomplete data, we must be careful that removal of data does not cause a sample to misrepresent the population. Adding data in artificially should be a method of last resort.
Missing values can affect the way a Machine Learning model works in a negative way. It’s important to quickly verify the existence of the data gap, and the location of those gaps.
Continuous, Ordinal, and Categorical data
The awareness of what exactly the data represents can help us choose the right machine learning model.
- Continuous data: Refers to numerical information that can have any value.
- Categorical data: Anything that does not fall into continuous category.
- Binary: A type of categorical data that can have on only two distinct categories or levels (e.g., “Yes” and “No”).
- Ordinal: A type of categorical data that can have a defined order and we can rank them, for example: Small, Medium and Large, etc.
- Nominal: A type of categorical data that has no order, for example: Zip Codes, Political preferences, Literary genre, Employment status, etc.
category_encoders is an amazing Python library that provides 15 different encoding schemes.
#Python Library
!pip install category_encoders
import category_encoders as ca
Here is the list of the 15 types of encoding the library supports:
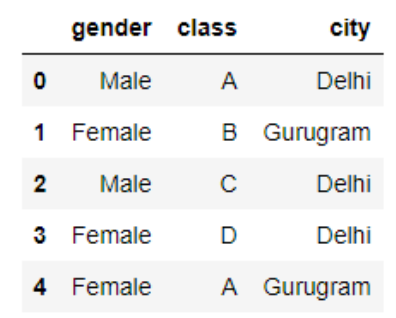
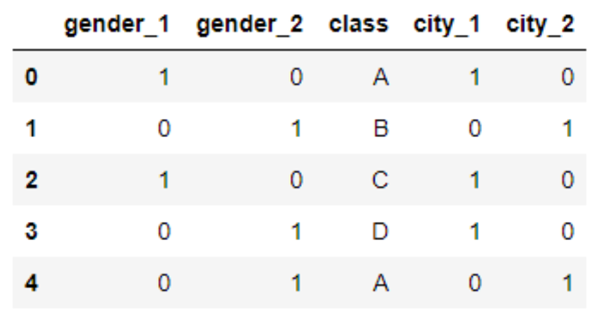
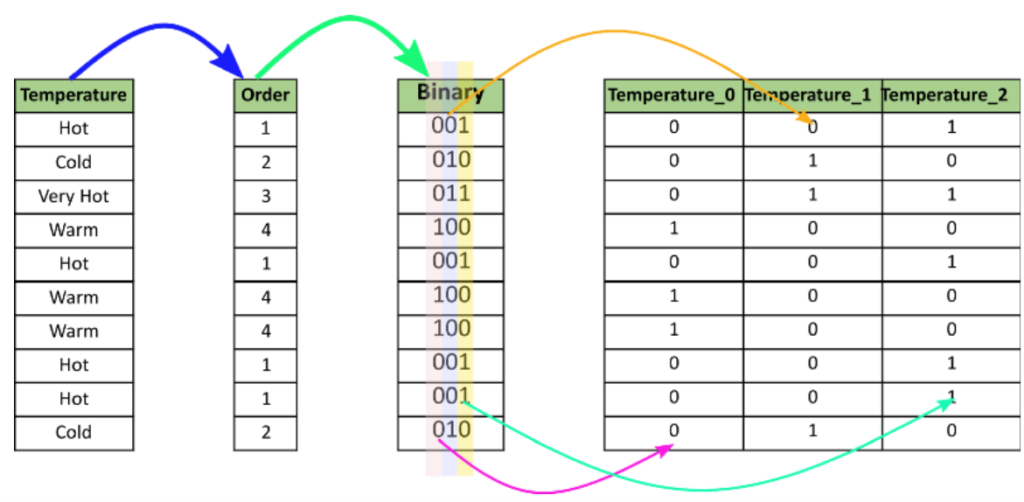
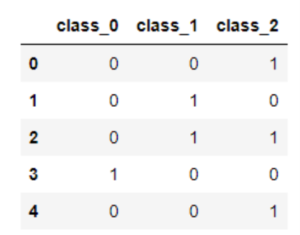
- One-hot Encoding
- Label Encoding
- Ordinal Encoding
- Helmert Encoding
- Binary Encoding
- Frequency Encoding
- Mean Encoding
- Weight of Evidence Encoding
- Probability Ratio Encoding
- Hashing Encoding
- Backward Difference Encoding
- Leave One Out Encoding
- James-Stein Encoding
- M-estimator Encoding
- Thermometer Encoder
Datatypes, Derived Datatypes
Datatypes refer to the type of data that a computer stores. For example, Integer, Float, String, Boolean, and Null (also referred to as None or Void). Derived Datatypes are the types of data that are using one or more primitive datatypes to store data. For example, Date, Images, 3D models, etc.
Generally:
- To work with continuous data, floating point numbers become the best choice.
- Ordinal data typically encodes with integer values.
- Categorical data involving only two categories can usually encode as Boolean or integer data.
Visualizing Continuous Data
Continuous data are usually best viewed by either:
- An XY scatter plot, especially for relationships between two continuous features
- Histogram, Box or Whisker plots, to look at the spread of data

Visualizing Categorical Data
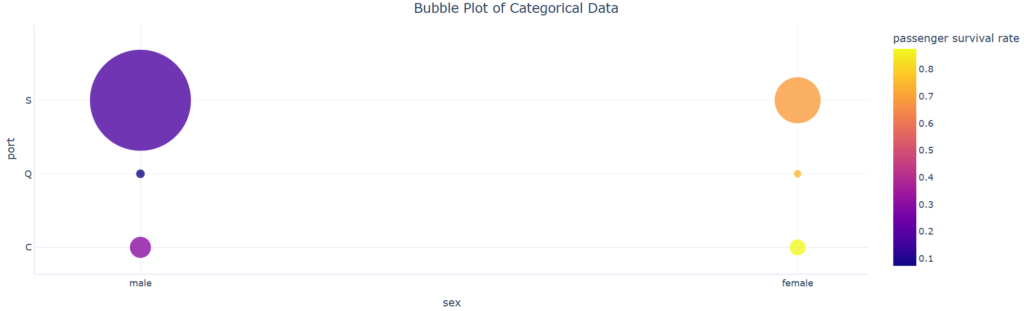
Categorical data are usually viewable in a similar way to ordinal data, but with data viewed as order-less groups. Alternatively, categories appear as colors, or groups, in other kinds of plots.
Plotting categorical data against other categorical data shows how data is clustered. This is little more than a colored table.
Data Reprocessing
We can make use of a Scikit-Learn feature named pipelines. These pipelines allow us to define a set of preprocessing steps that end with an algorithm. You can then fit the entire pipeline to the data, so that the model encapsulates all of the preprocessing steps as well as the regression algorithm. This is useful, because when we want to use the model to predict values from new data, we need to apply the same transformations (based on the same statistical distributions and category encodings used with the training data).
Real-world data issues
It’s important to realize that most real-world data are influenced by factors that weren’t recorded at the time. For example, we might have a table of race-car track times alongside engine sizes; but various other factors that weren’t written down, such as the weather, probably also played a role. If problematic, we can often reduce the influence of these factors by increasing the size of the dataset.
In other situations, data points that are clearly outside of what’s expected—also known as “outliers“—can sometimes be safely removed from analyses, although we must take care to not remove data points that provide real insights.
Another common issue in real-world data is bias. Bias refers to a tendency to select certain types of values more frequently than others in a way that misrepresents the underlying population, or “real world”. Bias can sometimes be identified by exploring data while keeping in mind basic knowledge about where the data came from.
Real-world data will always have issues, but data scientists can often overcome these issues by:- Checking for missing values and badly recorded data.
- Considering removing obvious outliers.
- Examining what real-world factors might affect their analysis and determining if their dataset size is large enough to reduce the impact of these factors.
- Checking for biased raw data and considering their options to fix the bias, if found.