
Common applications of regression:
- Predicting prices: For example, a regression model could be used to predict the price of a house based on its size, location, and other features.
- Forecasting trends: For example, to forecast the sales of a product based on historical sales data and economic indicators.
- Identifying risk factors: For example, to identify risk factors for heart disease based on patient data.
- Making decision: For example, to recommend which investment to buy based on market data.
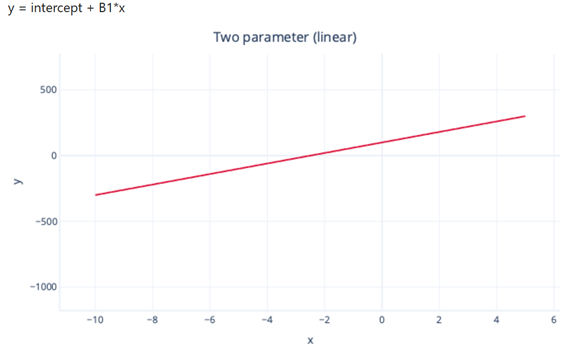
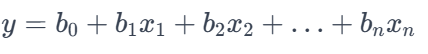
In linear regression models the relationship between the dependent variable and one or more independent variables is a linear equation:
- Simple Regression: is used to predict a single continuous dependent variable (Y) based on a single independent variable (Feature = X).
- Multiple Regression: is used to predict a single continuous dependent variable (Y) based on multiple independent variables (Features = x1,x2,x3,..,xn). The model expects features to be independent.
Other types of regression algorithms:
- Polynomial Regression: Polynomial regression is used to model nonlinear relationships between the dependent variable and the independent variables.
- Support Vector Regression (SVR): SVM is a type of algorithm that is used for classification tasks, but it can be also used for regression tasks.
- Decision Tree Regression: A decision tree is a tree-like structure that consists of nodes and branches. Each node represents a decision.
- Ridge Regression: Ridge regression is a type of linear regression that is used to prevent overfitting (when the model learns the training data too well and is unable to generalize the new data).
- Lasso Regression: Lasso regression is another type of linear regression that is used to prevent overfitting (by adding a penalty term to the loss function)
- Ensemble Algorithms: construct not just one decision tree, but a large number of trees, allowing better predictions on more complex data.
- Random Forest Regression: Ensemble algorithms, such as Random Forest, are widely used in machine learning and data science due to their strong prediction abilities.
- Boosting Ensemble Algorithms: A Gradient Boosting Regression, like a Random Forest algorithm builds multiple trees; but instead of building them all independently and taking the average result, each tree is built on the outputs of the previous one in an attempt to incrementally reduce the loss (error) in the model.
Regression Evaluation Metrics
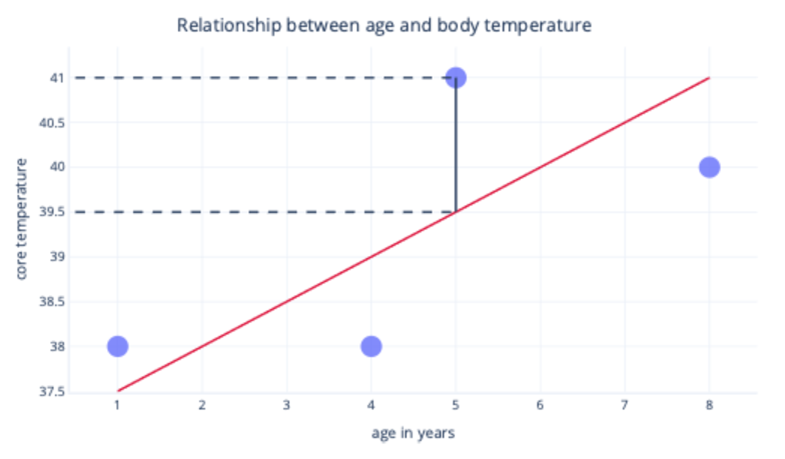
Regression models are evaluated based on their ability to minimize the error between the predicted and actual values of a target variable. In the following image, the black line indicates the error between the prediction (39.5), the red line, and the actual (41), the dot:
Most commonly, we fit a model by minimizing the residual sum (average) of squares. This means that the cost function is calculated like so:
- Calculate the difference between the actual and predicted values (as previously) for each data point.
- Square these values.
- Sum (or average) these squared values.
Common error metrics include:
- Mean Absolute Error (MAE): the average absolute difference between the predicted and actual values (Y) of the target variable.
- Mean Squared Error (MSE): The average squared difference between the predicted and actual values (Y) of the target variable. The smaller MSE is, the better our model is fitted.
- Root Mean Squared Error (RMSE)
- Huber Loss
- Root Mean Square Logarithmic Error
- R2: (or R2-score, R-squared, or sometimes known as coefficient of determination) is the correlation between feature (x) and label (y) squared. This produces a value between 0 and 1 that measures the amount of variance that can be explained by the model. Generally, the closer this value is to 1, the better the model predicts, meaning the model explains most of the variances between predicted and actual values. Roughly, the R-Squared is calculated by taking the loss/error of the trained model and dividing by the loss/error of the naive model then the whole thing is subtracted from 1 to flip those results, which we use to assess how well our model fits the data, with the number 0 meaning the model is ineffective and 1 meaning it fits perfectly.
Go back to Supervised Learning