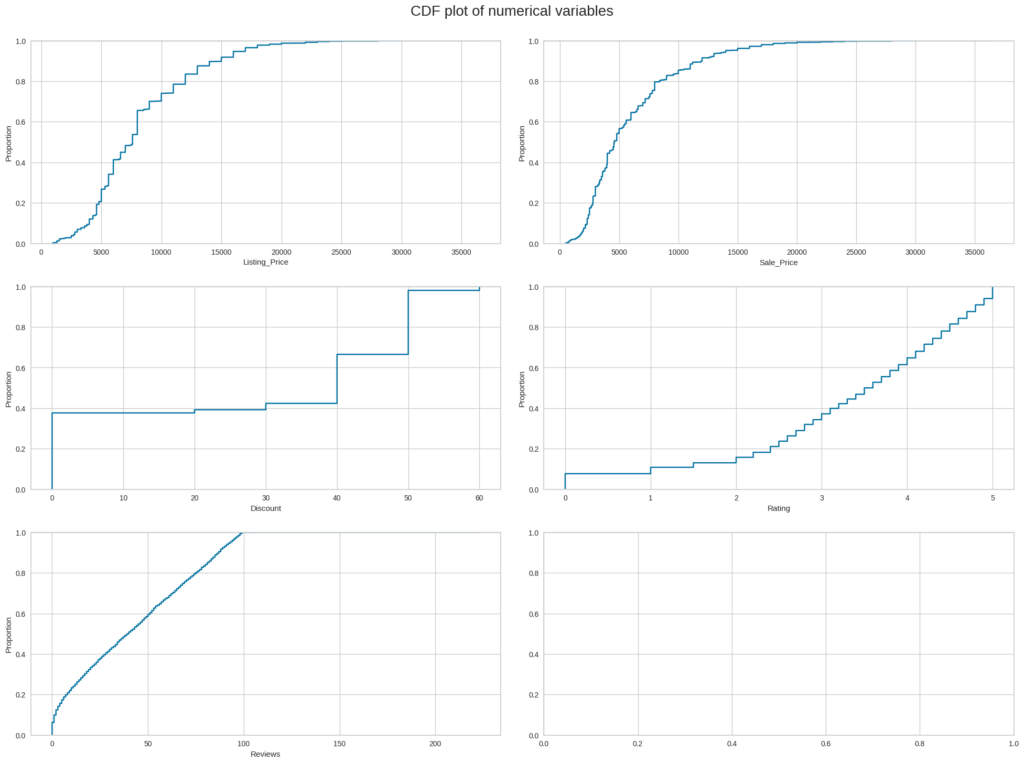
The provided code below generates a grid of subplots (dynamic rows and 2 columns) and plots cumulative distribution function (CDF) plots for numerical variables in a DataFrame (df).
num_col = df.select_dtypes(include=np.number).columns.to_list()
col_count = len(num_col)

fig_rows = (col_count // 2 ) + 1 if col_count % 2 != 0 else col_count //2

fig, axes = plt.subplots(fig_rows, 2, figsize=(20, 15))
fig.suptitle("CDF plot of numerical variables", fontsize=20)
counter = 0
for i in range(fig_rows):
    sns.ecdfplot(ax=axes[i][0], x=df[num_col[counter]])
    counter = counter + 1
    if counter != col_count:
        sns.ecdfplot(ax=axes[i][1], x=df[num_col[counter]])
        counter = counter + 1
    else:
        pass

fig.tight_layout(pad=2.0)


