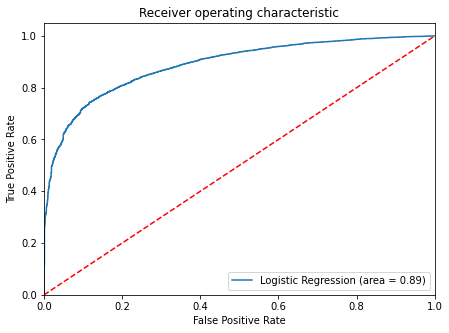
The ROC curve, in Machine Learning, is a graphical representation that illustrates the trade-off between true positive rate (sensitivity) and false positive rate (1 – specificity) across different thresholds for a binary classification model. AUC represents the degree or measure of separability, while ROC is a probability curve.
The ROC-AUC curve indicates how well the model can distinguish between classes. The greater the AUC, the better the model predicts correct classes (0 classes as 0 and 1 classes as 1). Similarly, the higher the AUC, the better the model distinguishes between patients with and without the disease.
The ROC curve is displayed with True Positive Rate (TPR) versus False Positive Rate (FPR), with TPR on the y-axis and FPR on the x-axis.

Tips: Classification error rate = 1 – Accuracy
